From Brexit to Trump’s presidential win to the Dow flirting with the 20,000 point record high, 2016 will go down in financial history as a year full of surprises.
The year opened with a decline in oil prices, a Chinese economic slowdown, and declining stock markets in February. Many financial pundits predicted a sinister outlook for stocks and a dive in the US markets if Trump were to be elected.
Despite the nervous headlines and gloomy forecasts, equity markets largely surged forward to post strong returns. This is yet another reminder for investors to stick to a well-diversified portfolio rather than reacting to new events or ‘expert’ predictions.
Equities surged, with Canadian stocks recording the biggest gains:
Your diversified portfolios produced strong results, thanks in large part to the allocations toward Canadian and US equities.
| 2016 TMA Model Portfolio Returns | |
| 100% Bonds | + 2.73% |
| 30% Equity 70% Bonds | + 5.96% |
| 50% Equity 50% Bonds | + 8.77% |
| 65% Equity 35% Bonds | + 10.40% |
| 75% Equity 25% Bonds | + 10.72% |
| 100% Equity | + 13.54% |
Note: Actual client portfolios may differ due to slightly different asset allocations. These returns are before TMA management fees.
| 2016 Index Returns (in Canadian dollars) * | |
| Cash | + 0.47% |
| Short Term Canadian bonds | + 1.01% |
| Canadian Bond Universe | + 1.66% |
| Canadian stocks | + 21.08% |
| US stocks | + 8.66% |
| International stocks | -1.98% |
| Emerging market stocks | + 7.91% |
| Canadian Dollar | + 3.08% |
*Note: These index returns are from: Canadian One-Month T-Bills, FTSE TMX Canada Short-Term Bond Index, FTSE TMX Canada Universe Bond Index, S&P/TSX Composite Index, S&P 500 Index, MSCI EAFE Index (net dividend), MSCI Emerging Market Index (net dividend). Indices are not available for direct investment and performance does not reflect expenses of an actual portfolio.
The strong performance of Canadian markets in 2016 was a welcome surprise for our client portfolios. With OPEC members committing to lift prices by cutting production, oil prices rose from US$39.09/barrel to US$53.33/barrel. The increase in energy and commodity prices contributed positively to our country’s resource-based equity market as well as our Canadian dollar. The dollar started the year at $0.7225 vs the USD and ended at $0.7448.
Perhaps an unexpected positive outcome for globally diversified investors was the surge in US equities after Trump’s presidential win. Overall, U.S. companies enjoyed another good year, even as the international markets experienced more muted results.
Bonds hit a wall
With bond yields being very low, Canadian and global fixed income yet again surprised investors by generating positive returns that were higher than inflation. While the Trump win was positive for stocks, it had the opposite effect on bonds and pushed prices lower. Bonds continued to protect investors’ portfolios during periods of market volatility.
Lessons from 2016
- Don’t rely on ‘expert’ forecasts
Markets are unpredictable. Unfortunately, investors often put too much weight on forecasts delivered by confident-sounding financial gurus. Dire predictions simply did not materialize in 2016 and investors who kept a steady hand on their portfolios benefited.
- Someone is buying
The year began with markets declining thanks to falling energy prices and depressed global growth outlooks. Quitting the equity market when prices are falling is like running away from a sale. Equity prices get discounted to reflect higher risk. However, with risk comes reward. While the media headlines proclaim that “investors are dumping stocks,” please remember someone is buying them on the other side of the trade. Those buyers are often long-term investors.
- Do not abandon a declining asset class
While the US and international markets posted positive returns in 2015, the resource sectors were going through a rocky period that caused Canadian equities to falter. But the Canadian market rallied in 2016 to record the strongest advance in the developed world equity markets. Staying invested in Canadian equities ensured that you did not miss this opportunity. Although not all asset classes had positive returns, a globally diversified portfolio produced attractive returns in 2016.
- Discipline is rewarded
The future remains uncertain. But it is important to never make any decisions based on speculation. The best strategy to endure market uncertainty is to follow a long-term investment plan that will keep you invested, diversified, and rebalanced in a timely manner across different regions and asset classes.
Investors are well served by staying the course with an asset allocation that reflects their needs, risk preferences, and objectives. Our commitment to long-term investing using asset class investing as our foundation has not wavered since day one – almost 20 years ago. We are thankful that our clients are fully engaged and embracing this way of investing too. We are grateful and appreciate your continued trust and confidence in us.
Regards,
Your team at Tulett, Matthews & Associates
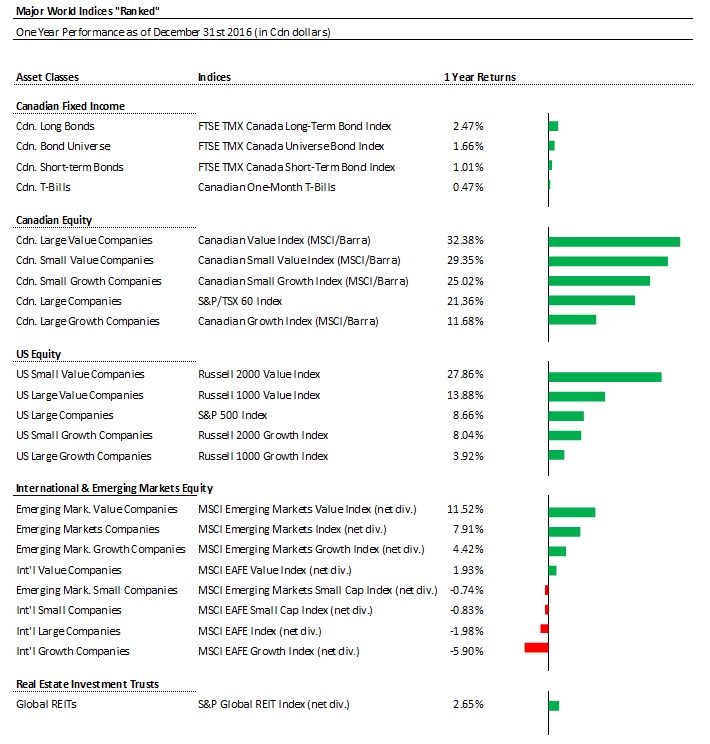
2016 Asset Class Returns
Despite the economic headwinds, all major equity market indices (in Canadian dollars) were positive in 2016, except for international developed markets.
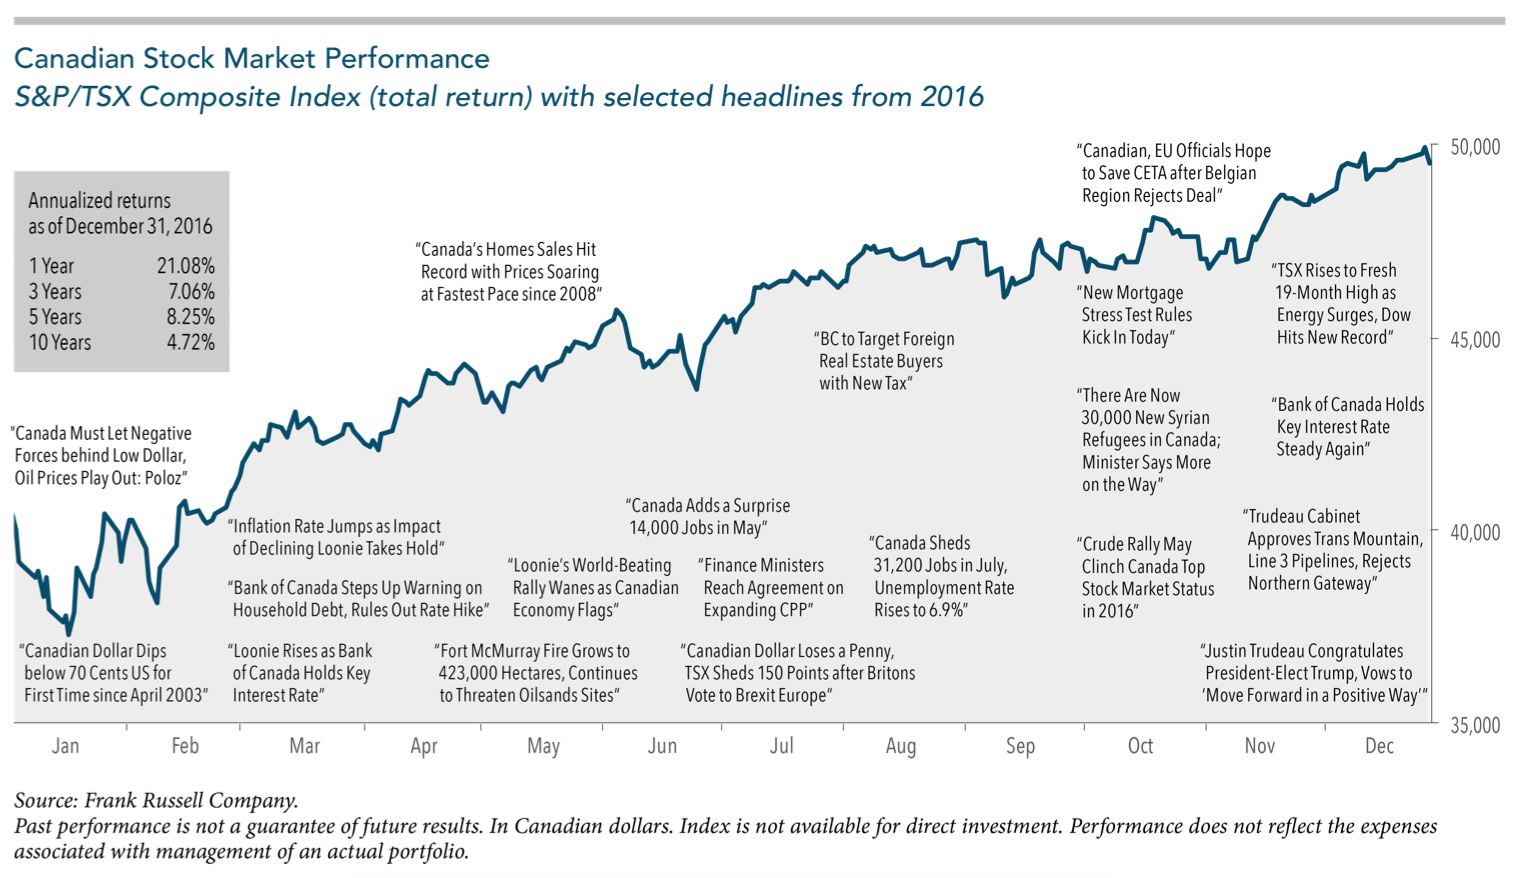
Canadian companies delivered the strongest returns for Canadian investors with the S&P/TSX 60 Index producing a total return of 21.36%. This chart offers snapshots of Canadian stock market performance, measured by the S&P/TSX Composite Index. The headlines should not be viewed as determinants of the market’s direction but as examples of events that may have tested investor discipline during the year.
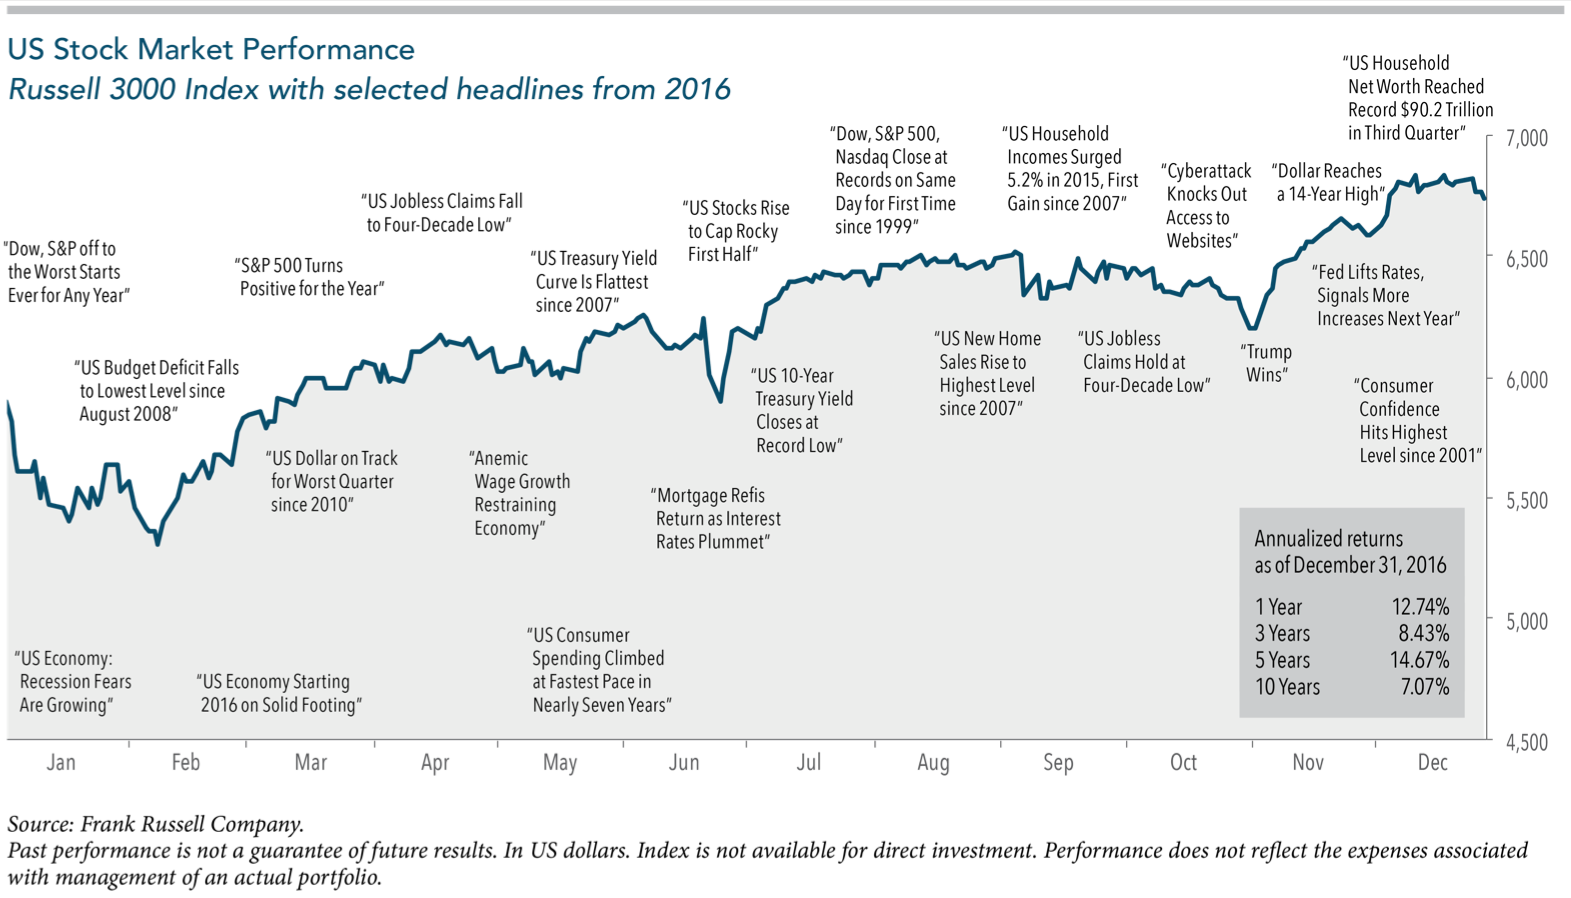
US companies delivered strong returns for Canadian investors with the S&P 500 Index producing a total return of 8.66%. The below chart highlights some of the year’s prominent headlines in context of broad US market performance, measured by the Russell 3000 Index.
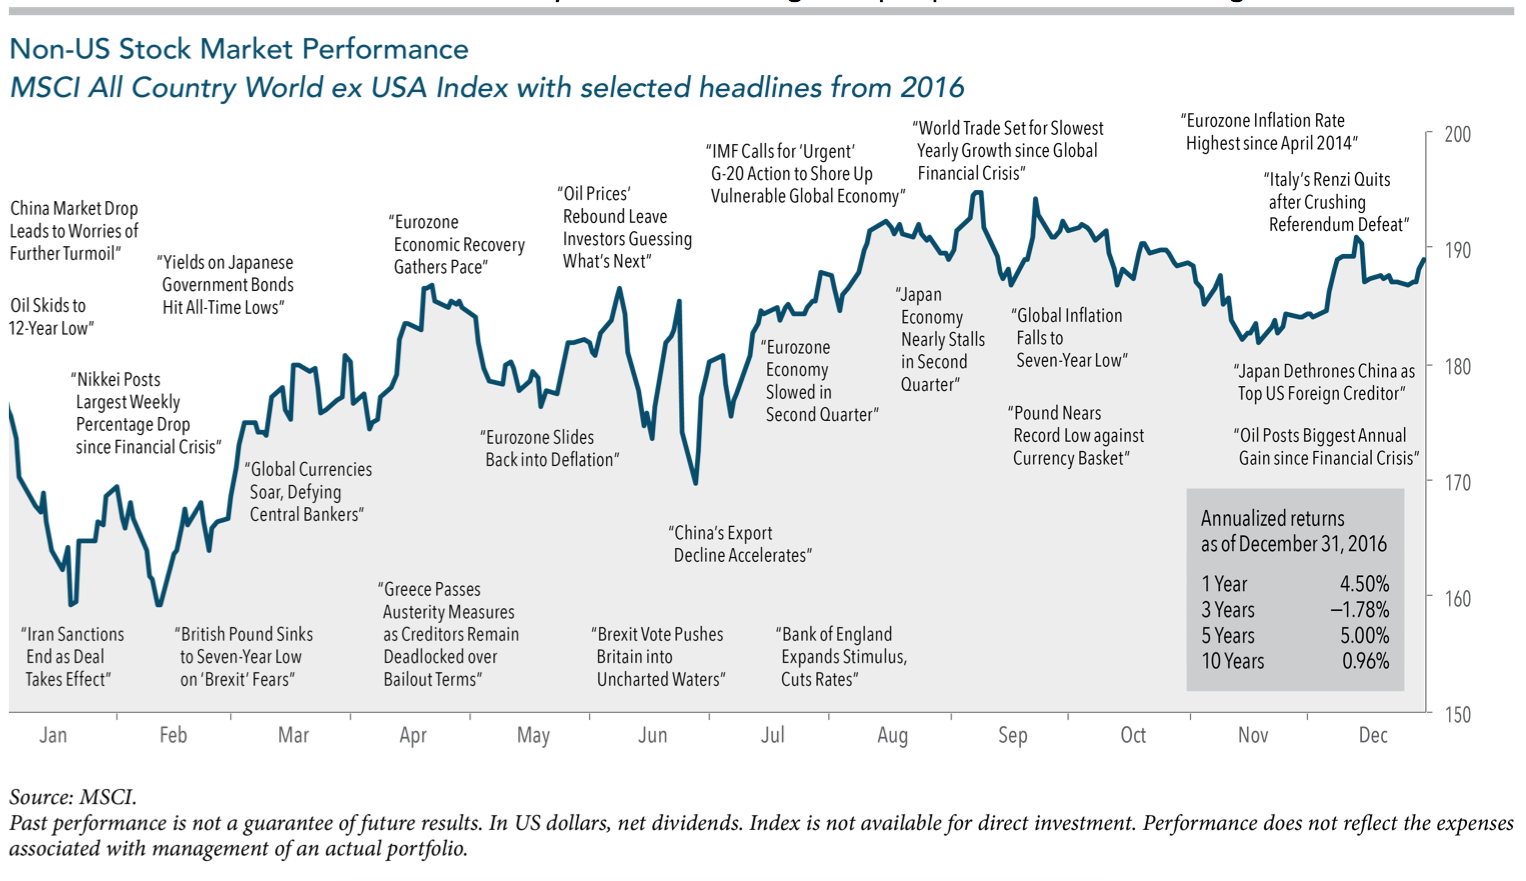
International companies delivered a small negative performance for Canadian investors. For the calendar year, the MSCI EAFE Index (net dividend) produced a total return of ‒1.98%. Emerging market companies delivered positive returns with the MSCI Emerging Market Index (net dividend) with a total return of +7.91%. Overall, performance among non-US markets as represented below by the MSCI World ex USA Index was slightly positive for Canadian investors. The graph below is in USD. Again, these headlines serve as a reminder that investors should view daily events from a long-term perspective and avoid making investment decisions based solely on the news.
Canadian fixed income returns were positive. The FTSE TMX Universe Bond Index returned 1.66% and its short-term counterpart 1.01%. Canadian one-month T-bills returned 0.47% for the year.
Canadian dollar returns were mostly positive relative to global currencies. The Canadian dollar progressed against the US dollar for a 3.08% performance.
Value and small company premium performance
Performance of value company stocks: In 2016, value companies outperformed growth companies in all geographic regions. Given that our portfolios are tilted to include higher allocations to value companies, our allocations to DFA Core strategies outperformed broad market indices. While this is not always the case, historically over long periods of time, value companies tend to outperform growth companies and produce a positive return premium to investors.
| Equity Market | Value Companies | Growth Companies | 1-Year Value Premium |
| Canada | +32.38% | +11.68% | +20.70% |
| US | +13.88% | +3.92% | +9.96% |
| International | +1.93% | -5.90% | +7.83% |
| Emerging Markets | +11.52% | +4.42% | +7.10% |
Performance of small company stocks:
In 2016, small companies also produced strong results. Small companies in Canada and in the US outperformed large companies. Small companies in international markets were negative, however outperformed large companies. Emerging markets was the only region in 2016 where small companies under-performed large companies.
| Equity Market | Small Companies | Large Companies | 1-Year Small Premium |
| Canada | +38.48% | +21.36% | +17.12% |
| US | +17.73% | +8.66% | +9.07% |
| International | -0.83% | -1.98% | +1.15% |
| Emerging Markets | -0.74% | +7.91% | -8.65% |
Taking a longer-term perspective, the premiums remain persistent over decades and around the globe. The small cap and value premiums are well-grounded in financial economics and verified using market data spanning decades, but pursuing those premiums requires a consistent, long-term investment approach.
Note: Canadian value companies are represented by the Canadian Value Index (MSCI/Barra), and the growth companies by the Canadian Growth Index (MSCI/Barra). US value companies are represented by the Russell 1000 Value Index, and the growth companies by the Russell 1000 Growth Index. International value companies are represented by the MSCI EAFE Value Index (net div.), and the growth companies by the MSCI EAFE Growth Index (net div.). Emerging markets value companies are represented by the MSCI Emerging Markets Value Index (net div.), and the growth companies by the MSCI Emerging Markets Growth Index (net div.). Indices are not available for direct investment and performance does not reflect expenses of an actual portfolio.
Note: Canadian small companies are represented by the S&P/TSX Small Cap Index, and the large companies by the S&P/TSX 60 Index. US small companies are represented by the Russell 2000 Index, and the large companies by the S&P 500 Index. International small companies are represented by the MSCI EAFE Small Cap Index (net dividend), and the large companies by the MSCI EAFE Index (net dividend). Emerging markets small companies are represented by the MSCI Emerging Market Small Cap Index (net dividend), and the large companies by the MSCI Emerging Market Index (net dividend). Indices are not available for direct investment and performance does not reflect expenses of an actual portfolio.