2023 Market Review
Rate Hikes, Rallies, and Reflections
If the 2023 market performance had been a dance, it would have been the tango, with an intricate interplay between optimism and angst culminating in a remarkably strong year for stocks and bonds alike.
While discord between expectations and returns is nothing new, 2023 was especially clear in illustrating the point. The year arrived on the heels of a tumultuous 2022, when many asset classes experienced double-digit losses, and U.S. Treasuries delivered their worst annual return in decades. But by year-end, global markets had rallied, bonds had reversed course, and the market had defied many prognosticators’ initially gloomy outlook.
After a fourth quarter stock surge, Canadian, US, international, and emerging market stocks posted 11.75%, 23.59%, 15.71% and 7.48% in annual performance, respectively. Canadian bonds returned 6.69% in their own banner year. Global real estate investment trust (REIT) returns also surged 7.87%.
However, as you probably remember for yourself, these impressive results were far from obvious at the outset, or even as the year progressed.
What’s in store for 2024? As usual, we won’t hazard a guess. All we know for now is that investors have shown cautious optimism in recent months, and economic measures have remained steady—so far—despite ongoing concerns about inflation, interest rates, and recessionary risks.
In other words, the dance continues.
Exhibit 1: 2023 Index Returns (in Canadian dollars)
| Fixed Income | |
| Cash and Equivalents | +4.77% |
| World Government Bond Index 1–5 Years | +4.66% |
| World Aggregate Credit Index 1-5 Year | +6.16% |
| Canadian Short-Term | +5.02% |
| Canadian Bond Universe | +6.69% |
| Canadian Equity | |
| Canadian Stocks (S&P/TSX Composite Index) | +11.75% |
| Canadian Value Stocks | +11.23% |
| Canadian Small Value Stocks | +6.26% |
| US Equity | |
| US Stocks (S&P 500 Index) | +23.59% |
| US Value Stocks | +9.27% |
| US Small Value Stocks | +12.19% |
| Developed International Equity | |
| International Stocks (MSCI EAFE) | +15.71% |
| International Value Stocks | +16.41% |
| International Small Value Stocks | +12.91% |
| Emerging Market Equity | |
| Emerging Market Stocks (MSCI Emerging Market) | +7.48% |
| Emerging Market Value Stocks | +11.77% |
| Emerging Markets Small Value Stocks | +21.44% |
| Real Estate investment Trusts (REITS) | |
| Global REITS | +7.87% |
| Canadian REITs | +2.62% |
| Currencies | |
| Canadian Dollar vs USD | +2.19% |
| Canadian Dollar vs Euro | -0.92% |
| Canadian Dollar vs Australian Dollar | +2.10% |
| Note: Indexes are in the endnotes of this commentary |
A 2023 TMA Takeaway: 2023 once again showed us how difficult it is to make investment decisions based on bold market predictions. The year highlighted the benefits of portfolio diversification and a clear investment philosophy to guide us forward. These timeless tenets not only help us stay on track toward our personal financial goals, they offer increased transparency, clarity, and peace of mind along the way.
Exhibit 2: 2023 TMA Model Portfolio Returns
| 30% Equity 70% Bonds | +8.38% |
| 50% Equity 50% Bonds | +10.00% |
| 60% Equity 40% Bonds | +10.81% |
| 65% Equity 35% Bonds | +11.22% |
| 75% Equity 25% Bonds | +11.73% |
| 100% Equity | +14.09% |
| Note: Actual client portfolios may differ due to slightly different asset allocations. These returns are before TMA management fees. |
2023 World Stock Markets Deliver … for Those Who Stayed Invested
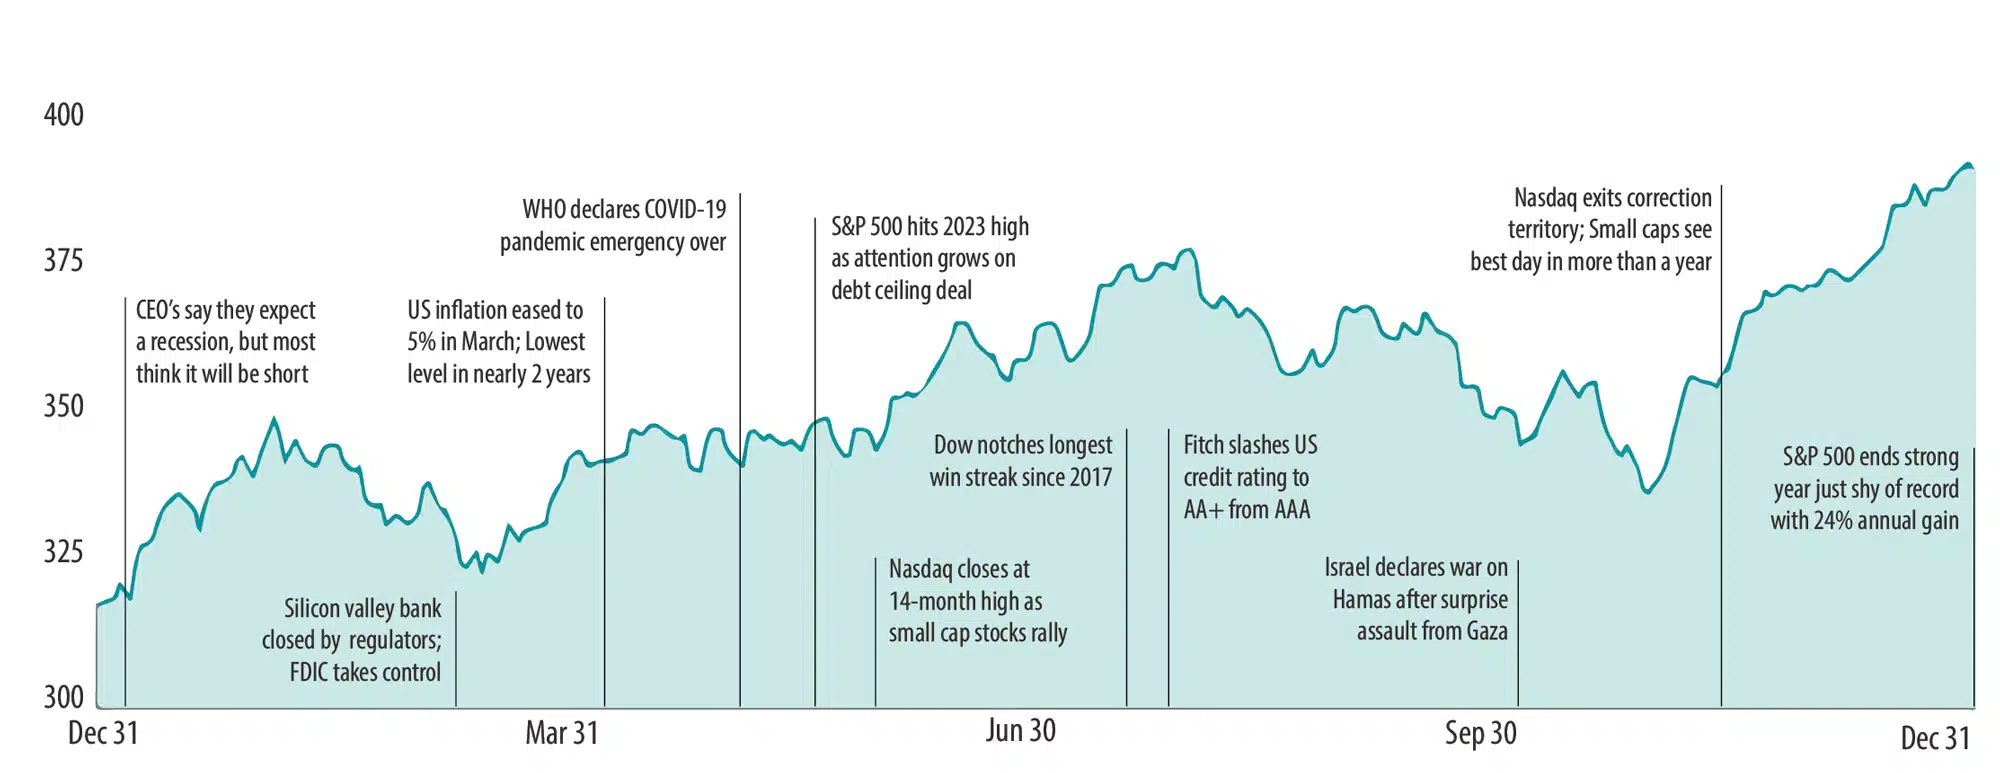
Our 2023 takeaways also apply globally. Exhibit 3 presents select headlines from the year, along with global market moves, as measured by the MSCI All Country World Index. Throughout the year, there were plenty of events sowing seeds of doubt around the world. But these headlines were better viewed as a test of investor discipline throughout the year, instead of as determinants of the market’s overall direction.
As long-term investors we are in pursuit of long-term returns, which are often delivered just when we least expect them. Thus, investors are best served by tuning out the headlines and committing to a long-term investment approach, unaffected by the daily news.
Exhibit 3: MSCI All Country World Index with select 2023 headlines.

In USD. MSCI All Country World Index, net dividends. MSCI data, MSCI 2024, all rights reserved. Indices are not available for direct investment; therefore, their performance does not reflect the expenses associated with the management of an actual portfolio. Headlines are sourced from various publicly available news outlets and are provided for context, not to explain the market’s behavior.
Interest Rates and Inflation Dominate 2023 Headlines.
Speaking of headlines, this year’s market narrative largely revolved around economic news focused on central banks, inflation, and interest rates.
In 2023, central banks orchestrated a finely tuned dance of monetary policy against the backdrop of a complex economic landscape. Global central banks—including the U.S. Federal Reserve, the Bank of Canada, and the European Central Bank—aggressively raised interest rates, aiming to strike a balance between taming inflationary pressures and keeping the economy moving forward.
For the economy, the year began with a focus on managing the aftermath of the challenges in 2022, primarily the lingering effects of the pandemic and inflationary pressures. Mid-year, the Fed, along with many global central banks, conveyed messages that interest rates would remain higher for longer, due to persistent inflation. These messages contributed to declines in stock prices and a surge in bond yields.
By fall, inflation was lowering and positive economic data showed an increasing likelihood of future interest rate cuts with the possibility of a “soft landing”. Investor sentiment shifted, as the Fed and BoC monetary policies seemed to be paying off. Their efforts seemed to help mitigate increased inflation without triggering a recession—at least so far. Year-over-year, Consumer Price Index (CPI) inflation peaked at 8.1% in June 2022 but had already dropped to 5.9% by January 2023. This downward trend continued throughout 2023, bringing CPI inflation down to just 3.1% as of November 2023.
Soft Landing Hopes Happen To Spur a Year-End Rally.
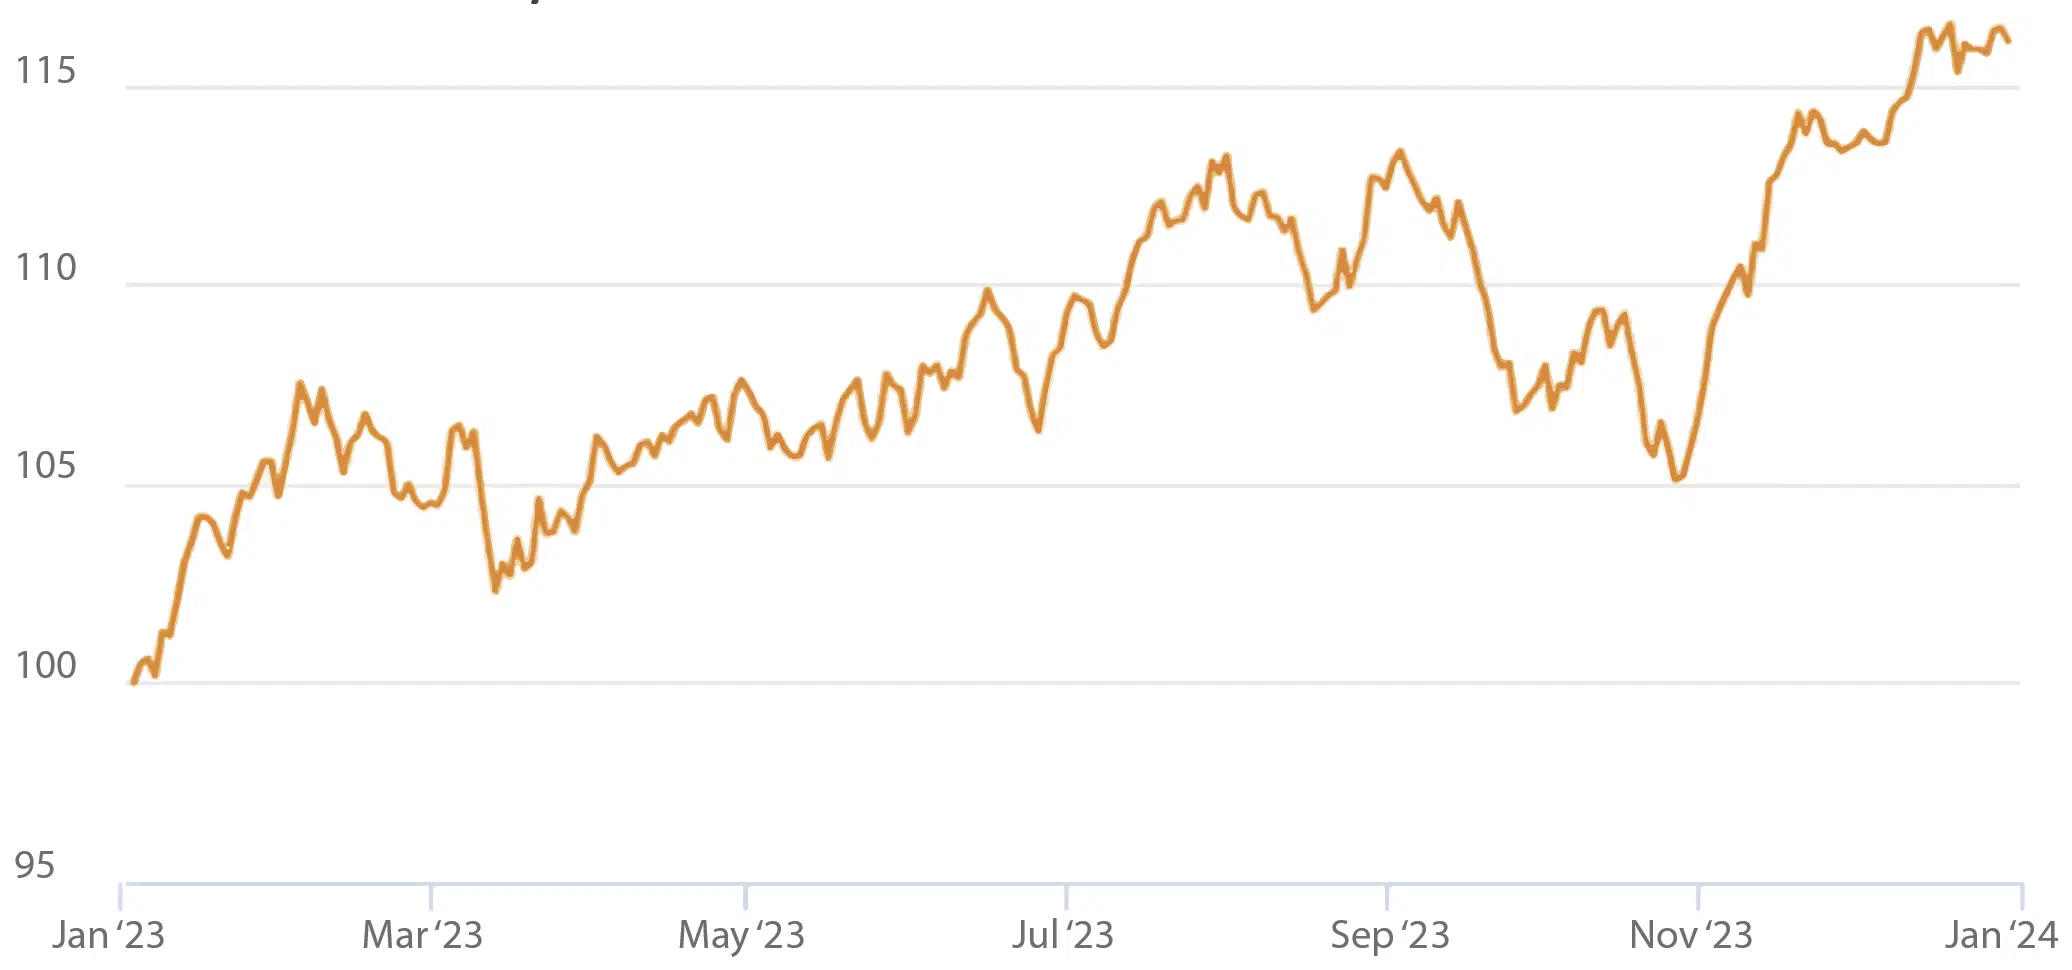
As the economic news shifted, financial markets staged a major year-end comeback, thanks in large part to renewed confidence in the Fed and BoC’s ability to engineer a soft landing. By the time the year was over, annual global stock returns were up 18.32% (MSCI All Country World IMI Index, in CAD).
Exhibit 4: MSCI All Country World IMI Index

Note: Total return performance, measured in CAD.
Again, the gains came late in 2023, as investors confidence grew, and market analysts weighed the probability of a “goldilocks cut”, where inflation falls, and economic growth remains strong.
In lock-step with investor sentiment, markets continued to price in new information quickly, efficiently, and often with head-spinning reversals. That’s what markets do. As optimism gained momentum in late 2023, it begat more optimism. For better or worse, that’s what investor sentiment often does. The shifting mood translated into a year-end surge in most markets. Select indexes delivered the following returns, for November–December alone:
- The U.S. market (S&P 500) rose 8.26%
- The Canadian market (S&P/TSX Composite) rose 11.39%
- International markets (MSCI EAFE, net div.) rose 9.15%
- 10-year Canadian Treasury yields dropped nearly 24%, leading to Canadian bonds surging 7.87% (measured by the FTSE Canada Universe Bond Index).
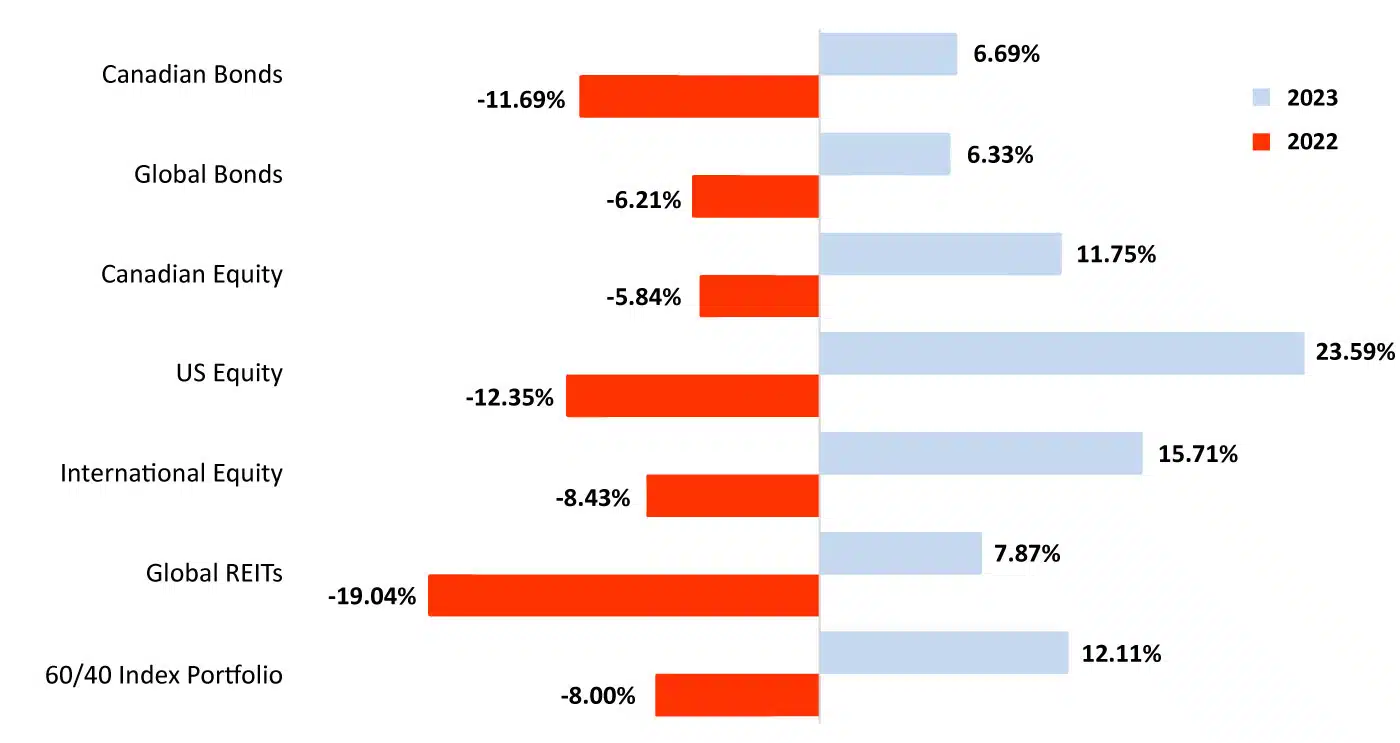
Overall, 2023 exhibited a well-rounded reversal from 2022.
Exhibit 5 presents the calendar year investment performance of 2022 versus 2023.
Exhibit 5: Then and Now: Markets flex strength in 2023 – a reversal of 2022’s challenges

Note: Indexes are in the endnotes of this commentary. Total return performance, measured in CAD.
A 2023 TMA Takeaway: Could 2023 have turned out otherwise? Yes, it could have. It wouldn’t have taken much of a shift in world events and investor moods to alter the outcome. Would that change our advice? No, it would not. Again, we’re taking the long view, which is well beyond a year or two. Pursuing more immediate news reminds us of what Morgan Housel wrote in his book, “Same as Ever”:
“A good summary of investing history is that stocks pay a fortune in the long run but seek punitive damages when you demand to be paid sooner.”
Check out our podcast with Housel. And for more information, please see our recent podcast on rising inflation and soft landing: Empowered Investor Episode 87 – An economic soft-landing? Yes, no, maybe…
Bonds Are Back!
Short-term pain can lead to long-term gain. This is a message for stock and bond markets alike, although it plays out in different ways.
In the bond market, the transition to a higher real interest rate environment has challenged bond investors in the last few years, with negative bond returns for two calendar years in a row in 2021 and 2022. Central banks increased policy rates at the fastest pace in decades, and 10-year Canadian Treasury yields increased by more than 300 basis points (3%). Long-term yields—a strong predictor for expected long-term returns—are now back at a level last seen before the 2008 global financial crisis.
As a result, expected returns for bond investors have risen significantly. The higher yields offer more from the interest income component of the market’s total return. Moreover, the expectation of lower future interest rates will be a welcome addition, as bond investors can expect to benefit from fresh capital appreciation, ultimately offsetting the capital losses from the past two years.
A 2023 TMA Takeaway: For long-term investors, the surge in interest rates is considered one of the most significant economic and financial developments in the past two decades. It’s expected to rejuvenate the classic “60/40” stock/bond portfolio, as the fixed income allocation is better positioned to pull its weight for the future. Well-diversified investors should welcome the prospect of higher real interest rates and the solid foundation they provide for long-term, risk-adjusted, portfolio-wide returns.
For more information, please see our recent podcast on how high interest rates affect bonds: Empowered Investor Episode 66 – Are rising interest rates a curse or a blessing?
2023 Themes: Artificial Intelligence and The Magnificent 7.
One of the biggest stock market buzzwords of 2023 was undoubtably AI. After ChatGPT burst onto the scene about a year ago, many investors started chasing this sector du jour by piling into AI-related stocks. The hottest ones even scored a popular nickname: the Magnificent 7, comprised of Alphabet, Amazon, Apple, Microsoft, Meta, Nvidia and Tesla. (Admittedly, Tesla isn’t exactly AI-related, but close enough.)
The Magnificent 7 stocks continue to dazzle investors as they race past the bulk of global equities. Their outperformance is notable, but not for the reasons you might think. Investors who lack a long-range plan tend to assume the eye-popping returns are a clarion call to invest more heavily in them. But if we heed the historical evidence, there are different insights to be gained.
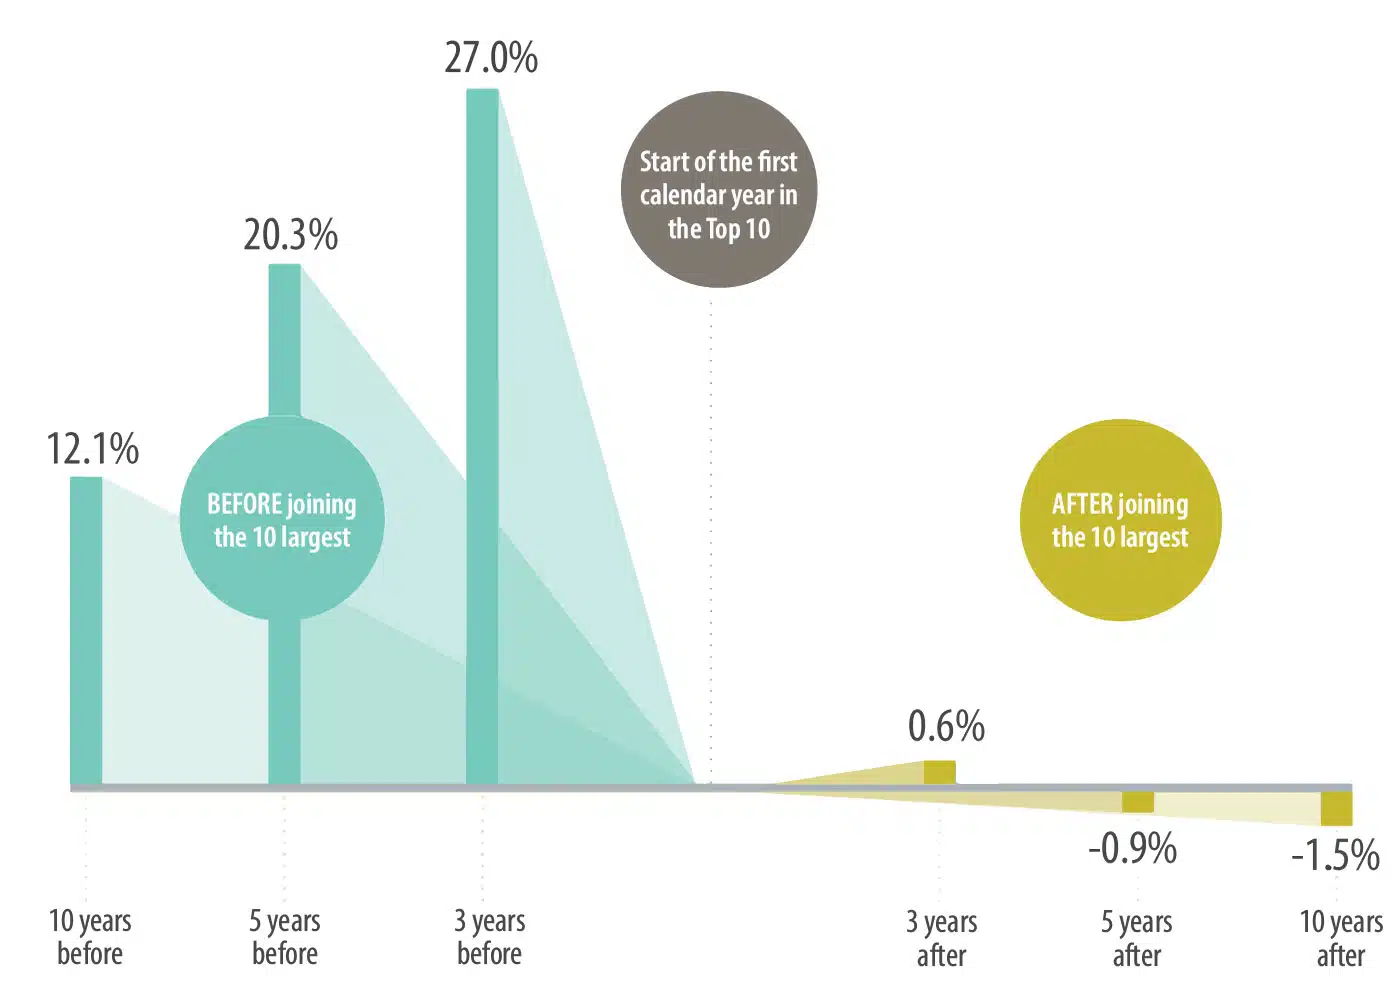
Today’s biggest winners become tomorrow’s ho-hum losers: Subsequent returns for hot stocks that have reached the top tend to lag rather than beat the market moving forward. (See exhibit 6.)
Stock-picking remains ill-advised: No matter how you try to justify it, over-concentrated positions in a few hot stocks exposes investors to increased risks, without increasing expected long-term returns. Even if you manage to identify a few winners, research argues that good luck is unlikely to repeat over a lifetime of investing. For every investor who happens to get into and out of a hot stock at the right time, there are scores more who end up buying high and/or selling low in pursuit of yesterday’s news.
Exhibit 6: A View from the Top:
Annualized return in excess of the U.S. market after joining the top 10 largest US stocks (1927–2022)

Source: Dimensional Fund Advisors. In USD. Data from CRSP and Compustat.
Companies are sorted every January by beginning-of-month market capitalization to identify first-time entrants into the top 10.
A 2023 TMA Takeaway: Hot stocks and catchy nicknames are best thought of as cautionary tales for those who hang their hopes on their continued outperformance. Rather than seeking additional exposure to mega-cap stocks, investors are better served by rebalancing their portfolio away from them, as befitting their own investment plans. This not only helps investors sell recent winners at a gain, it keeps their portfolios more broadly diversified, to capture the returns from whatever popular trends ascend next.
How Did 2023 TMA Model Portfolios Perform?
Exhibit 7: TMA Model Portfolio Returns (as of December 31st, 2023)
The table below lists various TMA portfolio allocations using Dimensional asset class strategies and their respective annual returns from 2006–2023.
2023 and Calendar Year TMA Model Portfolio Returns
| Date | 30% Equity 70% Bonds | 50% Equity 50% Bonds | 60% Equity 40% Bonds | 65% Equity 35% Bonds | 75% Equity 25% Bonds | 100% Equity |
|---|---|---|---|---|---|---|
| 2006 | 7.87% | 11.43% | 13.22% | 14.11% | 15.90% | 20.44% |
| 2007 | 1.54% | -0.26% | -1.15% | -1.60% | -2.49% | -4.64% |
| 2008 | -7.01% | -13.99% | -17.35% | -19.00% | -22.23% | -29.96% |
| 2009 | 10.40% | 14.53% | 16.59% | 17.62% | 19.67% | 24.90% |
| 2010 (1) | 8.52% | 10.23% | 11.05% | 11.45% | 12.05% | 14.17% |
| 2011 | 1.96% | -1.12% | -2.69% | -3.46% | -5.34% | -9.05% |
| 2012 | 7.65% | 9.13% | 9.86% | 10.22% | 10.94% | 12.66% |
| 2013 | 6.83% | 12.18% | 14.94% | 16.32% | 19.38% | 26.27% |
| 2014 | 6.59% | 7.37% | 7.74% | 7.95% | 7.93% | 9.19% |
| 2015 | 3.18% | 4.08% | 4.51% | 4.73% | 5.12% | 6.17% |
| 2016 (2) | 6.09% | 8.24% | 9.31% | 9.85% | 10.49% | 13.54% |
| 2017 | 5.55% | 7.80% | 8.94% | 9.51% | 10.40% | 13.59% |
| 2018 | -1.87% | -3.38% | -4.14% | -4.53% | -5.27% | -7.30% |
| 2019 | 9.49% | 11.95% | 13.19% | 13.81% | 14.63% | 18.22% |
| 2020 | 5.16% | 5.89% | 6.13% | 6.22% | 5.98% | 6.24% |
| 2021 | 5.13% | 9.60% | 11.87% | 13.03% | 15.53% | 21.32% |
| 2022 | -8.35% | -7.51% | -7.11% | -6.91% | -5.82% | -5.61% |
| 2023 | 8.38% | 10.00% | 10.81% | 11.22% | 11.73% | 14.09% |
| Summary Statistics (January 1st 2006 to Dec 31st 2023) | ||||||
| 1-Year Return | 8.38% | 10.00% | 10.81% | 11.22% | 11.73% | 14.09% |
| 3-Year Return | 1.46% | 3.70% | 4.82% | 5.38% | 6.73% | 9.32% |
| 5-Year Return | 3.76% | 5.74% | 6.71% | 7.18% | 8.11% | 10.40% |
| 10-Year Return | 3.81% | 5.23% | 5.93% | 6.27% | 6.87% | 8.57% |
| 18-Year Return | 4.14% | 5.13% | 5.59% | 5.82% | 6.20% | 7.26% |
| Growth of $1 | $2.12 | $2.52 | $2.74 | $2.85 | $3.04 | $3.66 |
| Standard Deviation | 4.64% | 6.67% | 7.77% | 8.32% | 9.37% | 12.36% |
| Actual client portfolios may differ due to slightly different asset allocations. Model portfolio returns are before TMA management fees but after Dimensional Fund Advisor management fees. (1): As of January 1st 2010, TMA Model Portfolios include DFA Investment Grade Fixed Income (F). (2) As of January 1st 2016, TMA Model Portfolios include DFA Targeted Credit Fund (F). |
What Have We Learned?
As we look back at 2023, at least one thing is as loud and clear as ever: Steer clear of reacting to bold market predictions. It’s still hard, if not impossible to predict short- to medium-term market movements.
Late in 2022, many analysts were predicting a rocky year for the economy and markets alike. At first, these predictions seemed accurate. 2023 launched with negative and stressful headlines, including continued war in the Ukraine coupled with a new potential U.S. banking crisis. Later in the year, conflicts in the Middle East heightened.
And yet, to recap, the MSCI All Country World IMI Index returned an annual 18.32% by year-end. Go figure.
It may help to remember that people have memories, expectations, and emotions that skew their view. We know there will be recessions, interest rate changes, elections, and evolving technologies. We know there will be surprises we can’t yet fathom. We also know that markets don’t care about any of that as they go about their daily pricing. As Housel wrote:
“Every investment price, every market valuation, is just a number from today multiplied by a story about tomorrow. … But the stories are often bizarre reflections of people’s hopes, dreams, fears, insecurities, and tribal affiliations.”
A 2023 TMA Takeaway: We continue to advise you to seek long-term capital growth according to your own financial plans, rather than making moves based on today’s favorite “stories”. This, we believe, is the best way to grow and protect your long-term financial security in our fast-paced world.
Looking Forward to 2024.
2023’s economic and market developments demonstrated that markets continue to function, and remain adept at efficiently pricing in new information. The year’s positive stock and bond returns remind us that even in challenging years, investors committed to a sensible investment philosophy, can still build long-term wealth.
What of 2024? In some respects, it resembles every other year. As usual, the turn of the calendar brings many questions yet to be answered about the economy, interest rates, inflation, and global markets. It offers fresh challenges and opportunities alike.
To prepare for whatever lies ahead, we consider it our privilege and responsibility to offer these perspectives for tuning out the daily noise and staying focused on personal goalposts. Here is a short video that exemplifies how we try to help provide this peace of mind: Tune Out the Noise Video
We look forward to seeing and speaking with you soon. In the meantime, should you have any questions, please do not hesitate to contact us. We are here to answer your questions and address your needs.
On behalf of all of us at Tulett, Matthews & Associates, we wish you a happy and healthy 2024.
Tulett, Matthews & Associates
The Empowered Investor Podcast: More Power to You:
Some of us are voracious readers. Others prefer to learn by listening. Maybe you enjoy a bit of both.
No matter how you like to hone your investment acumen, TMA is committed to delivering our perspective in the formats that work best for you. Whether in blog, email, or podcast form, our aim is the same: We want to offer engaging insights you can use to think through the ideas, emotions, and actions that impact your financial worth and personal wellbeing.
Our Empowered Investor Podcast is one way we’ve continued the conversation with you. (April 2024 will mark our fourth full year of delivering fresh episodes to our clients!) Below is a list of last year’s episodes you might have missed. We hope you’ll tune in to as many as you’re able, and send us any questions or comments you may have.
- 2023 Financial Year in Review and Looking Ahead for 2024
- Book Review: Same as Ever, by Morgan Housel
- International Diversification Part 2: Not so crazy
- Why Global Diversification is Good for Canadian Investors
- The Dividend Trap: How Seeking Stability Might Limit Your Returns
- Lifestyle Creep: The Silent Threat to Your Retirement Plans
- TMA Book Review: Psychology of Money by Morgan Housel
- Inspired Retirement – Maximizing retirement satisfaction
- Mid-year investment review: inflation down, resilient economy, stocks up!
- How do reverse mortgages work?
- Enemy #1 in Investing: Your Brain!
- Understanding Cybersecurity: Education, Prevention, and Response Strategies
- Take Advantage of the New First Home Savings Account
- An Investor’s Guide to Expected Returns
- Navigating mortgages and high interest rates with specialist Morgan Englebretsen
- Debunking 8 common tax myths and misunderstandings (part 1)
- 2022 Tax Tips – With Life-Long Expert
- Investor Beware: How to Protect Your Money from Scams and Fraud
- Building Confidence Through Annual Review Meetings
- Should you Die with Zero?
- 2022 Financial Year in Review and Looking Ahead for 2023
Endnotes:
Exhibit 1:
FTSE Canada 30-day T-Bill, FTSE World Government Bond Index 1–5 Years (hedged to CAD), Bloomberg Global Aggregate Credit Bond Index 1-5 Years (hedged to CAD), FTSE TMX Canada Short-Term Bond Index, FTSE Canada Universe Bond Index, S&P/TSX Composite Index, MSCI Canada Value Index, MSCI Canada Small Value Index (net div.), S&P 500 Index, Russell 3000 Value Index, Russell 2000 Value Index, MSCI EAFE Index (net div.), MSCI EAFE Value Index (net div.), MSCI EAFE Small Value Index (net div.), MSCI Emerging Market Index (net div.), MSCI Emerging Markets Value Index (net div.), MSCI Emerging Markets Small Value Index (net div.), S&P/TSX Capped REIT Index and the S&P Global REIT Index (net div.). Indices are not available for direct investment and performance does not reflect expenses of an actual portfolio.
Exhibit 5:
Canadian bonds: FTSE Canada Universe Bond Index, Global bonds: Bloomberg Global Aggregate Bond Index (CAD Hedged), Canadian stocks: S&P/TSX Composite Index, US stocks: S&P 500 Index, International stocks: MSCI EAFE Index (net div.), Global REITs: S&P Global REIT Index (net div.). Indices are not available for direct investment and performance does not reflect expenses of an actual portfolio.

Connect
Visit Us
3535 St-Charles Blvd.
Suite 703
Kirkland, Quebec
H9H 5B9
Connect