
Keith Matthews
Partner & Portfolio Manager
Playing the Long Game – Evidence-Based Investing (Part 1)
Short, Medium & Long-Term Asset Class Returns
In order to be successful investors, we must prioritize realizing our long-term objectives over chasing short-term gains. Straying from our principles in the attempt to benefit from short- and medium-term investment trends can be a costly diversion. The desire to capitalize on the latest ‘flavour of the month’ has proven to be a tempting trap for countless investors over the years. A disciplined, long-term approach to investing might not provide much of a rush, but the added perspective it provides will help us achieve our goals.
‘Flavour of the month’
Over time, sections or even entire asset classes of a diversified portfolio move in and out of favour. For example, the last ten years (2009-2019) have seen US and International equity asset classes outperform Canadian equities. Global REITs (Real Estate Investment Trusts), and closer to home, Canadian residential home prices, have also appreciated significantly.
Within industry sectors, resource companies (materials & energy) have lagged the broader market, and on an investment style basis, global value stocks have underperformed vs. global growth stocks.
Asset classes, factor exposures, (such as small and value companies) and investment themes will always move in and out of favour over time. However, asset pricing trends can usually be expected to reverse at some point as valuations catch up and re-adjust.
The last twenty years have provided us with a fascinating landscape to observe how investment trends within a diversified portfolio move in and out of favour. We will delve a little deeper and review two key equity portfolio drivers:
- Asset allocation and regional exposure (Canadian companies vs. US and International companies).
- Investment style and factor exposures (small companies and value companies).
This article will focus exclusively on asset allocation and regional exposure. We will tackle investment style and factor exposures in Part 2. To add perspective, we will break down the last twenty years into two component review decades: the last decade (2009-2019), then the previous decade (1999-2009) and we will conclude with a review of the past twenty years (1999-2019).
1: Asset allocation & regional exposure
(Canadian vs. US and International companies)
Let’s begin with how asset classes have performed over the last decade: US stocks, FAANG stocks (Facebook, Amazon, Apple, Netflix, and Google) have led the charge while Canadian stocks and resource stocks have underperformed.
As the table below shows, the US market experienced the highest returns while the Canadian market posted the lowest.
Last ten years – 10 year returns as of June 30th, 2019 (CAD)
| Equity Benchmark | Performance Rank | Return |
|---|---|---|
| US equities (S&P 500 Index) | 1 | 16.07% |
| International developed equities (MSCI EAFE Index) | 2 | 7.92% |
| Canadian equities (S&P/TSX Composite Index) | 3 | 7.79% |
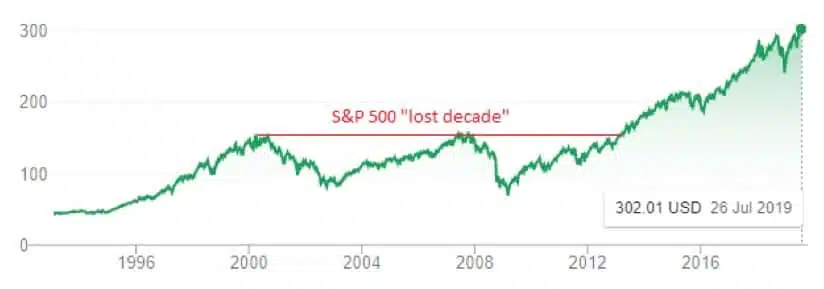
However, the years 1999-2009 tell a different story as Canadian equities produced the highest returns while US equities produced the lowest. American investors refer to this ten-year period as “the lost decade”. An investor who invested $100,000 CAD in US equities (S&P 500) in 1999 would have seen that allocation drop to $64,000 CAD in 2009.
Previous ten years – 10 year returns as of June 30th, 2009 (CAD)
| Equity Benchmark | Performance Rank | Return |
|---|---|---|
| Canadian equities (S&P/TSX Composite Index) | 1 | 6.15% |
| International developed equities (MSCI EAFE Index) | 2 | -1.11% |
| US equities (S&P 500 Index) (the lost decade) | 3 | -4.43% |
S&P 500 Lost Decade (2000 – 2012)
Chart of SPY – the ETF tracking the S&P 500 Index – in Canadian dollars (1994-2019)
When these two decades are combined into a single 20-year period, the discrepancies in returns are reduced between the major benchmarks.
Last twenty years – 20 year returns as of June 30th, 2019 (CAD)
| Equity Benchmark | Performance Rank | Return |
|---|---|---|
| Canadian equities (S&P/TSX Composite Index) | 1 | 6.97% |
| US equities (S&P 500 Index) | 2 | 5.32% |
| International developed equities (MSCI EAFE Index) | 3 | 3.43% |
Diversification Helps Take the Guesswork out of Investing [i]
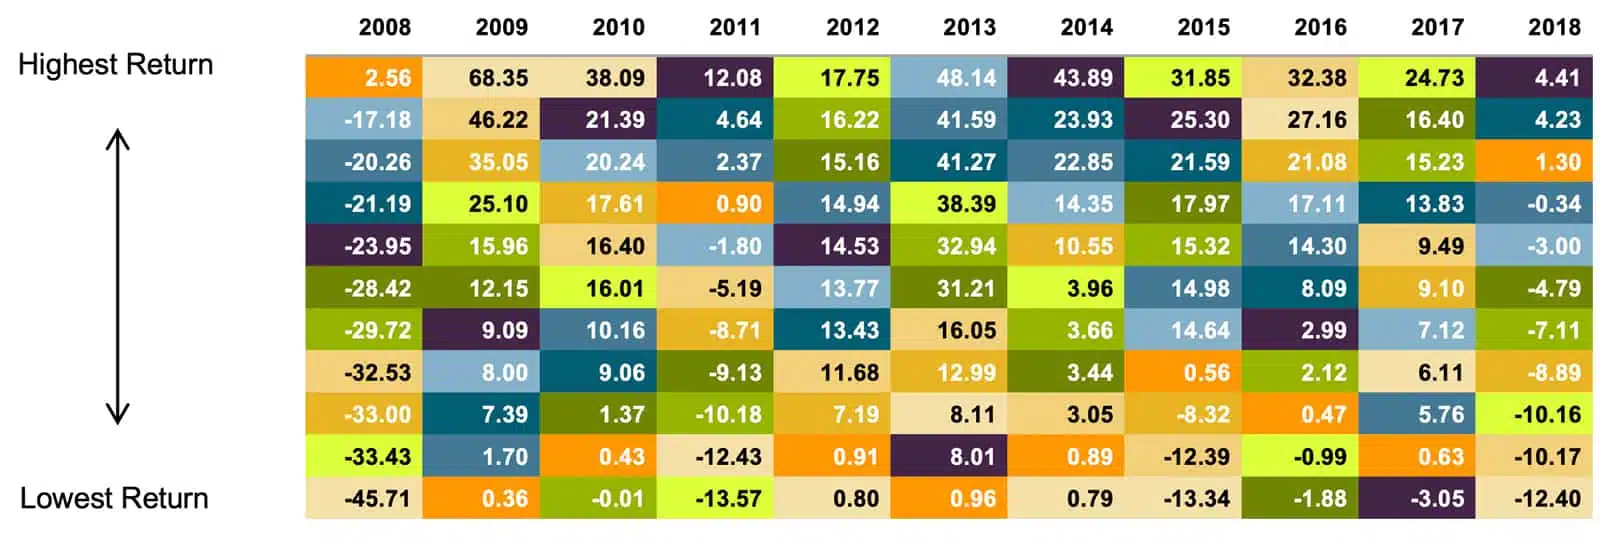
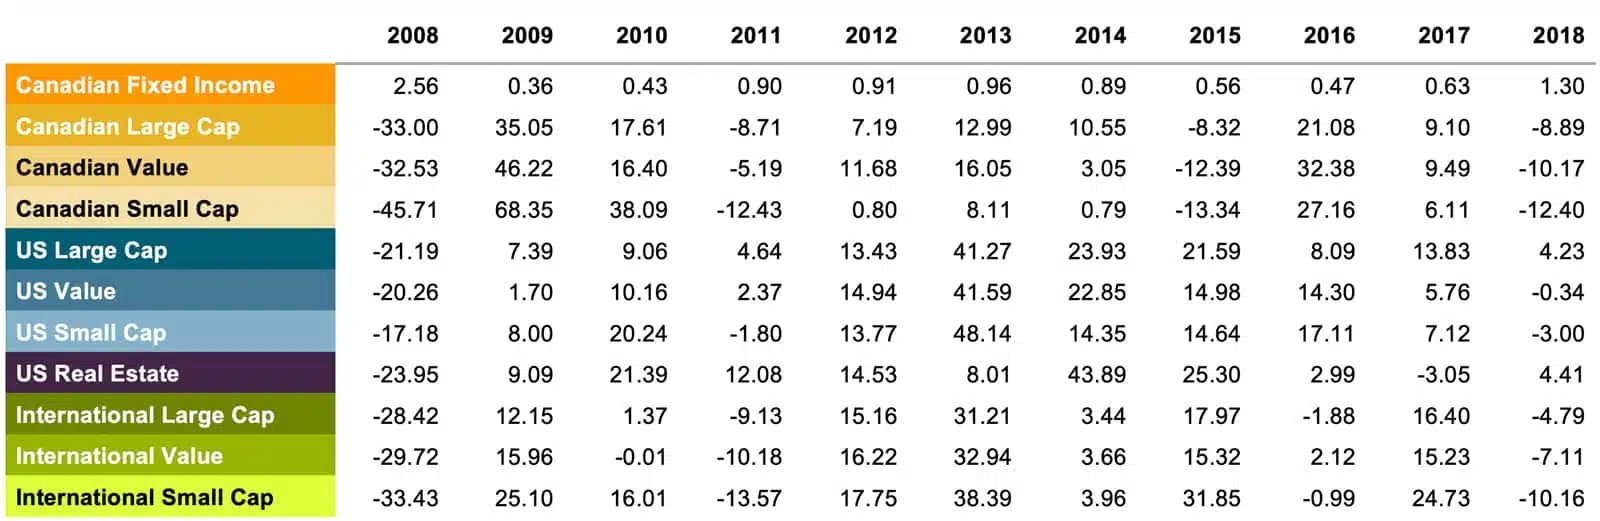
It is extremely difficult to identify which markets will outperform from year to year. By holding a globally diversified portfolio, investors are positioned to capture returns wherever they occur. The chart below stacks asset class performance from lowest to highest during each of the past eleven calendar years. The lack of any discernable patterns shows just how unpredictable asset class returns can be.
The Randomness of Returns (2008-2018)
Evidence-based investing
The last twenty years have provided us with tremendous insight into how asset allocation and regional exposures can move in and out of favour. In Part 2 of this series, we shall review how investment style and factor exposures (small companies and value companies) can do the same thing. One thing is clear; investors need to stay committed to a long-term investment philosophy. Jumping from one asset class to another is a recipe for lower returns and increased anxiety.
Long-term data and rigorous academic research have created a philosophy that investors can follow in order to help increase their odds of long-term success. We refer to this philosophy as evidence-based investing.
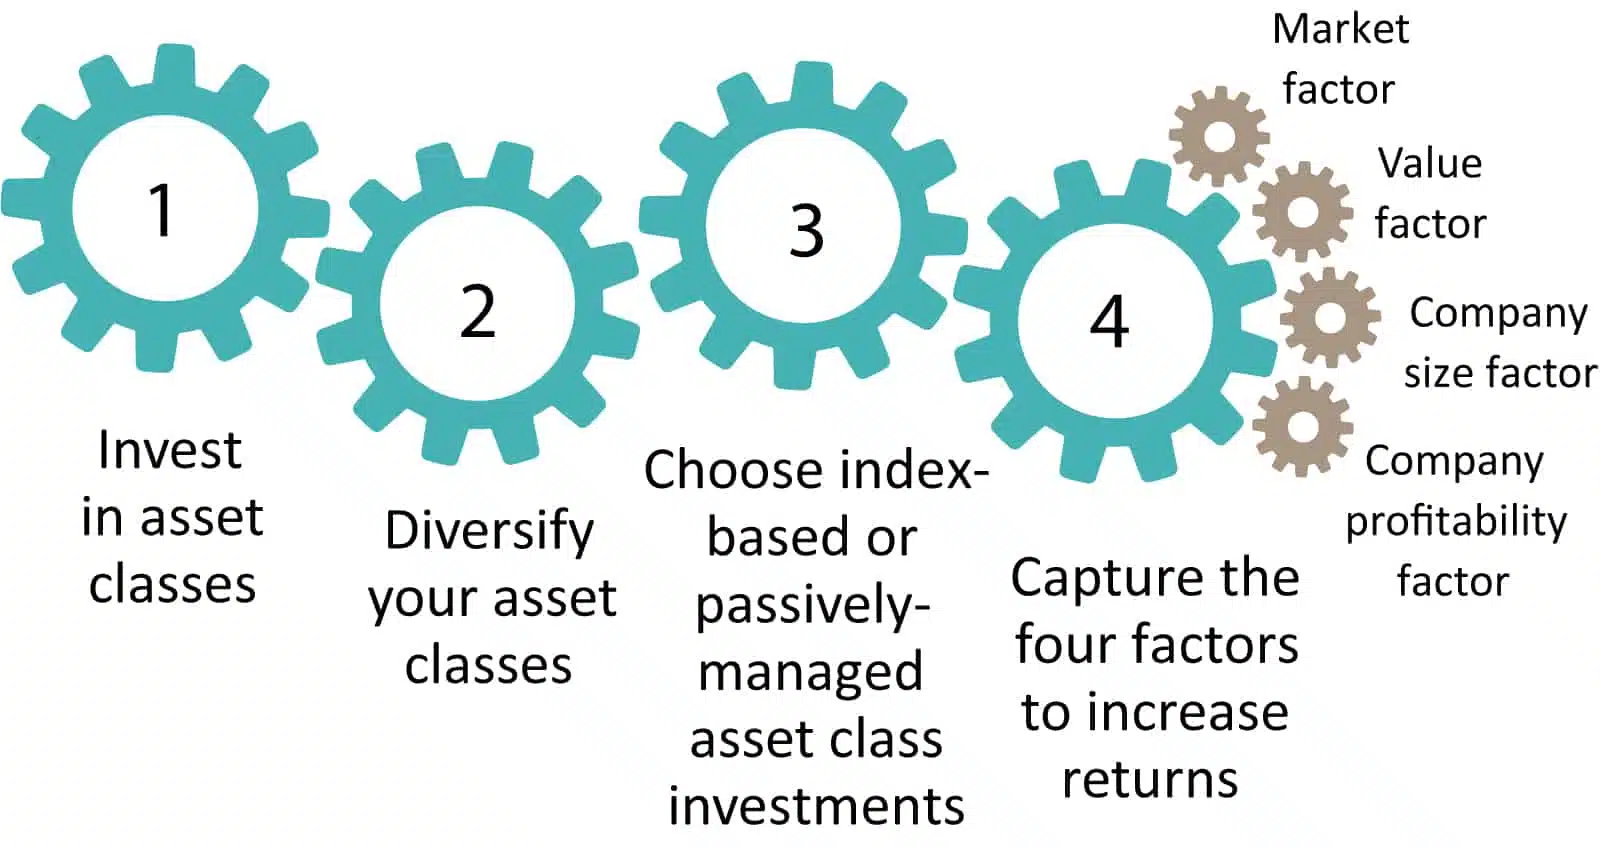
Evidence-based investing will grow and protect your capital over the long term. It is made up of the following four principles:
- Invest in asset classes
- Diversify your asset classes (reviewed in Part 1 of this series)
- Choose index-based or passively managed asset class investments
- Capture factors to increase returns (to be reviewed in Part 2 of this series)
[1] In Canadian dollars. Source: S&P and Dow Jones data © 2019 S&P Dow Jones Indices LLC, a division of S&P Global. All rights reserved. Frank Russell Company is the source and owner of the trademarks, service marks, and copyrights related to the Russell Indexes. Dimensional Index data compiled by Dimensional. MSCI data © 2019, all rights reserved. ICE BofAML index data © 2019 ICE Data Indices, LLC. Bloomberg Barclays data provided by Bloomberg. FTSE fixed income indices © 2019 FTSE Fixed Income LLC. All rights reserved. See “Index Descriptions” in the appendix for descriptions of Dimensional’s index data. Diversification does not eliminate the risk of market loss. Past performance is not a guarantee of future results. Indices are not available for direct investment. Their performance does not reflect expenses associated with the management of an actual portfolio.